SIFEL Home page
SIFEL - SImple Finite ELements
Parallel 3D Hygro-thermo-mechanical analysis of Charles bridge in Prague
Results from analysis
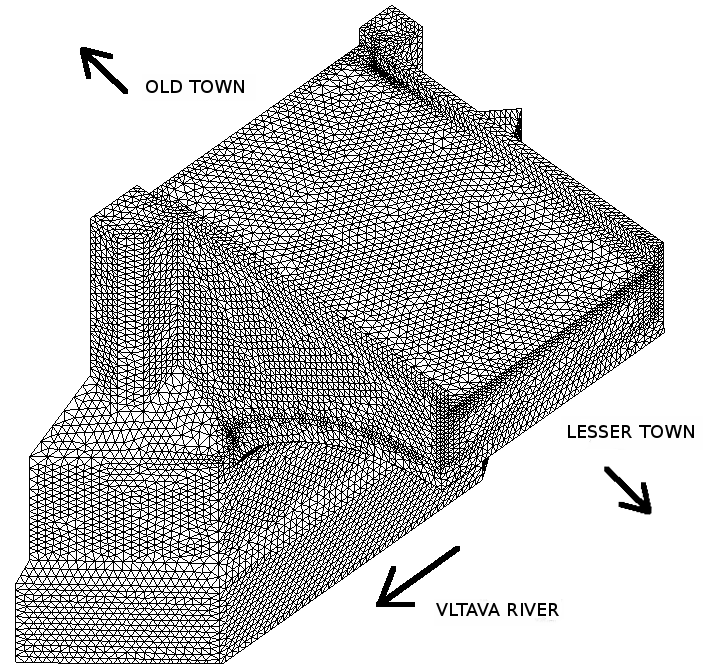
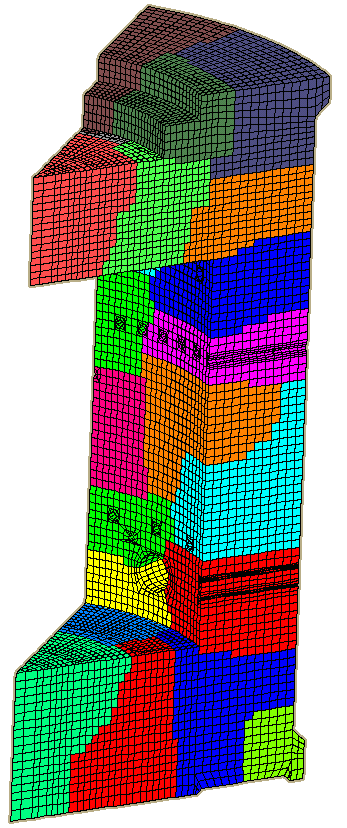
3D finite element mesh model of one half of the arch III (left) and its domain decomposition (right).
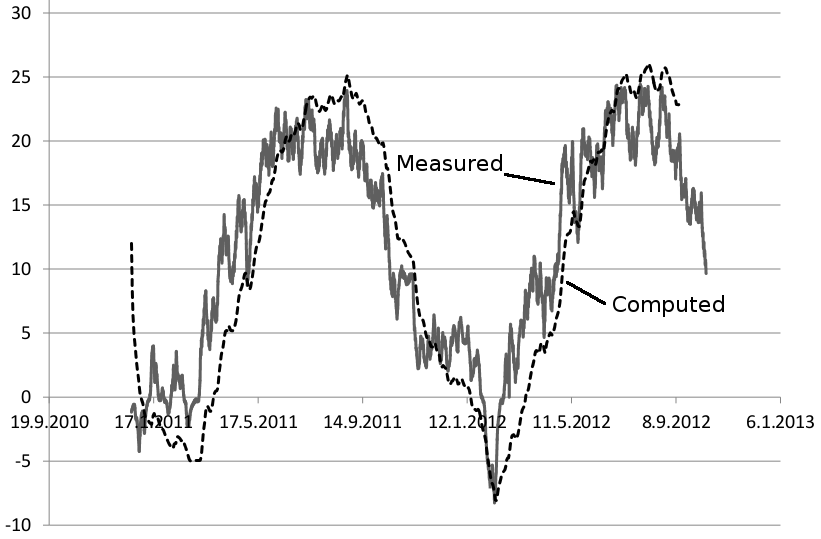
Distribution of temperature at selected gauge points 3A1 [degree centigrade].
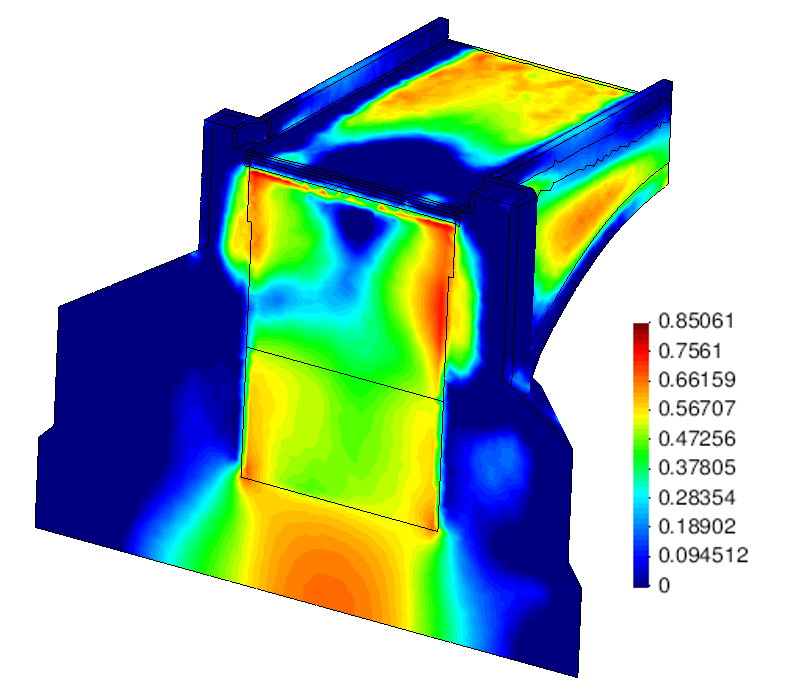
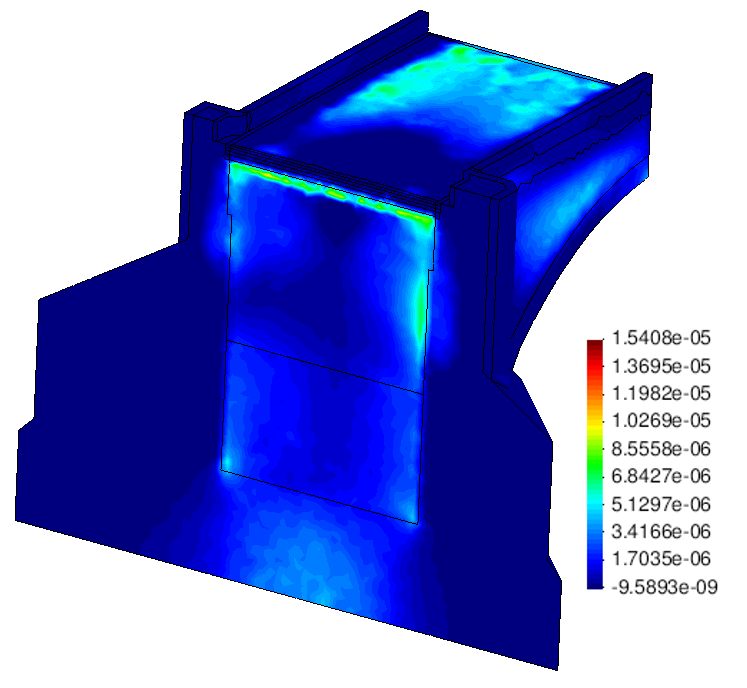
Spatial distribution of damage parameter in the bridge structure in summer time after one year cycle in the first principal direction (left) and corresponding width of cracks openings (right).
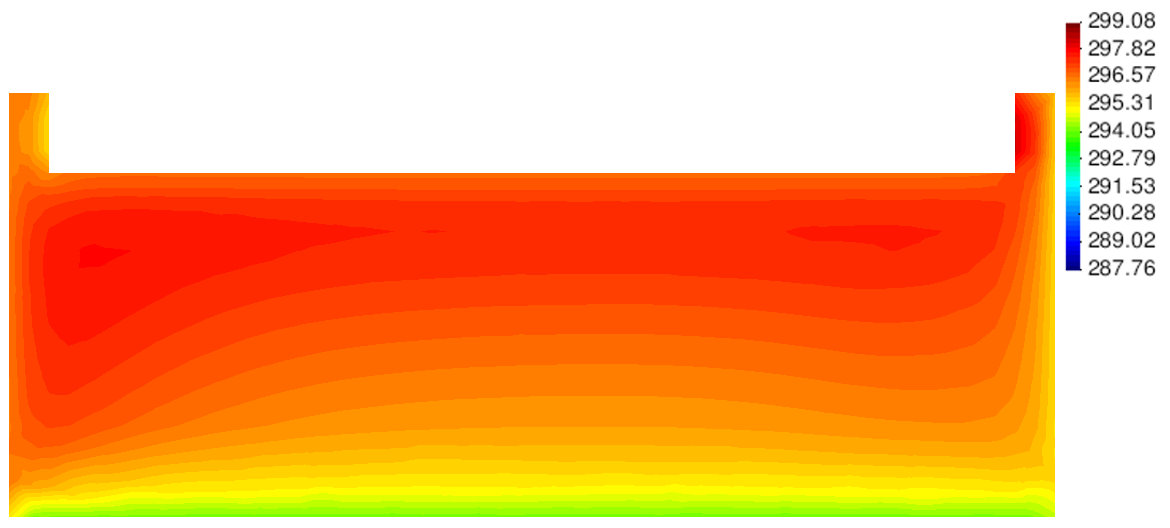
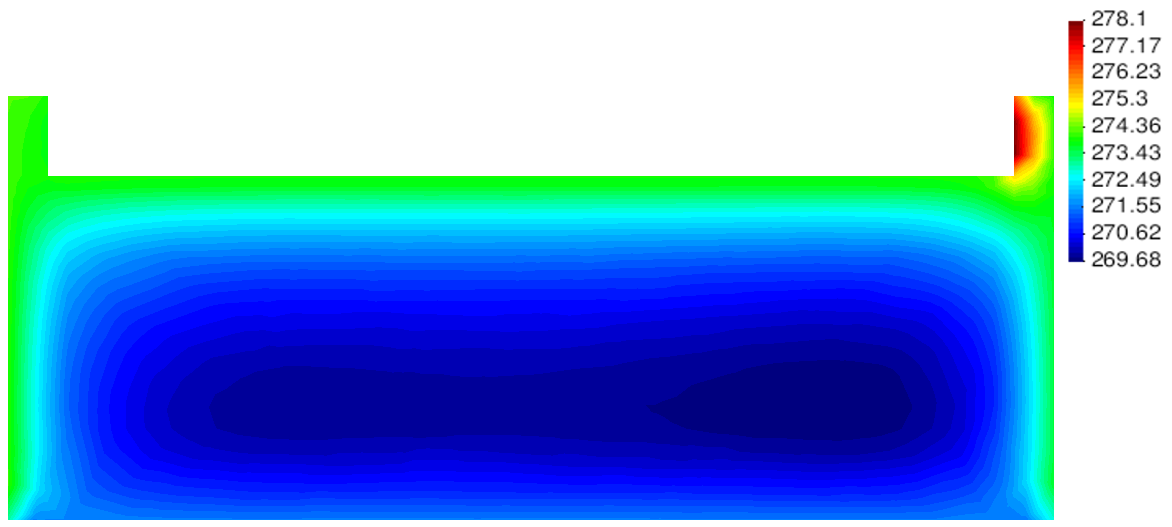
Spatial distribution of temperature [Kelvins] in cross-section 3 in summer (above) and in winter (below).
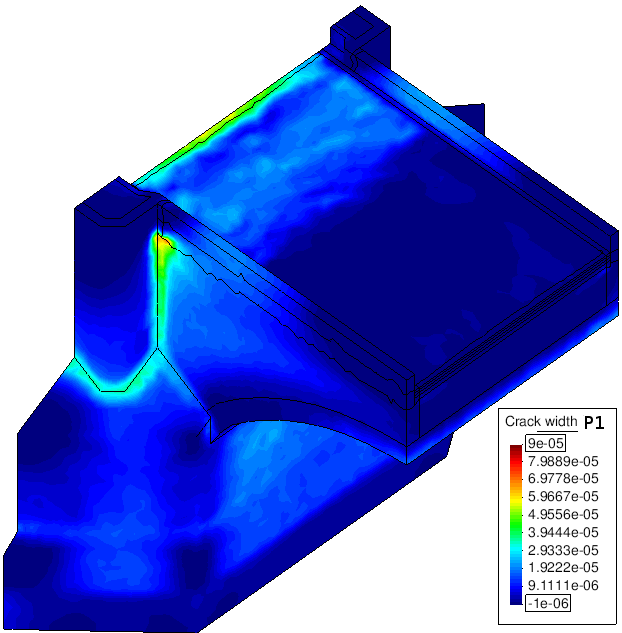
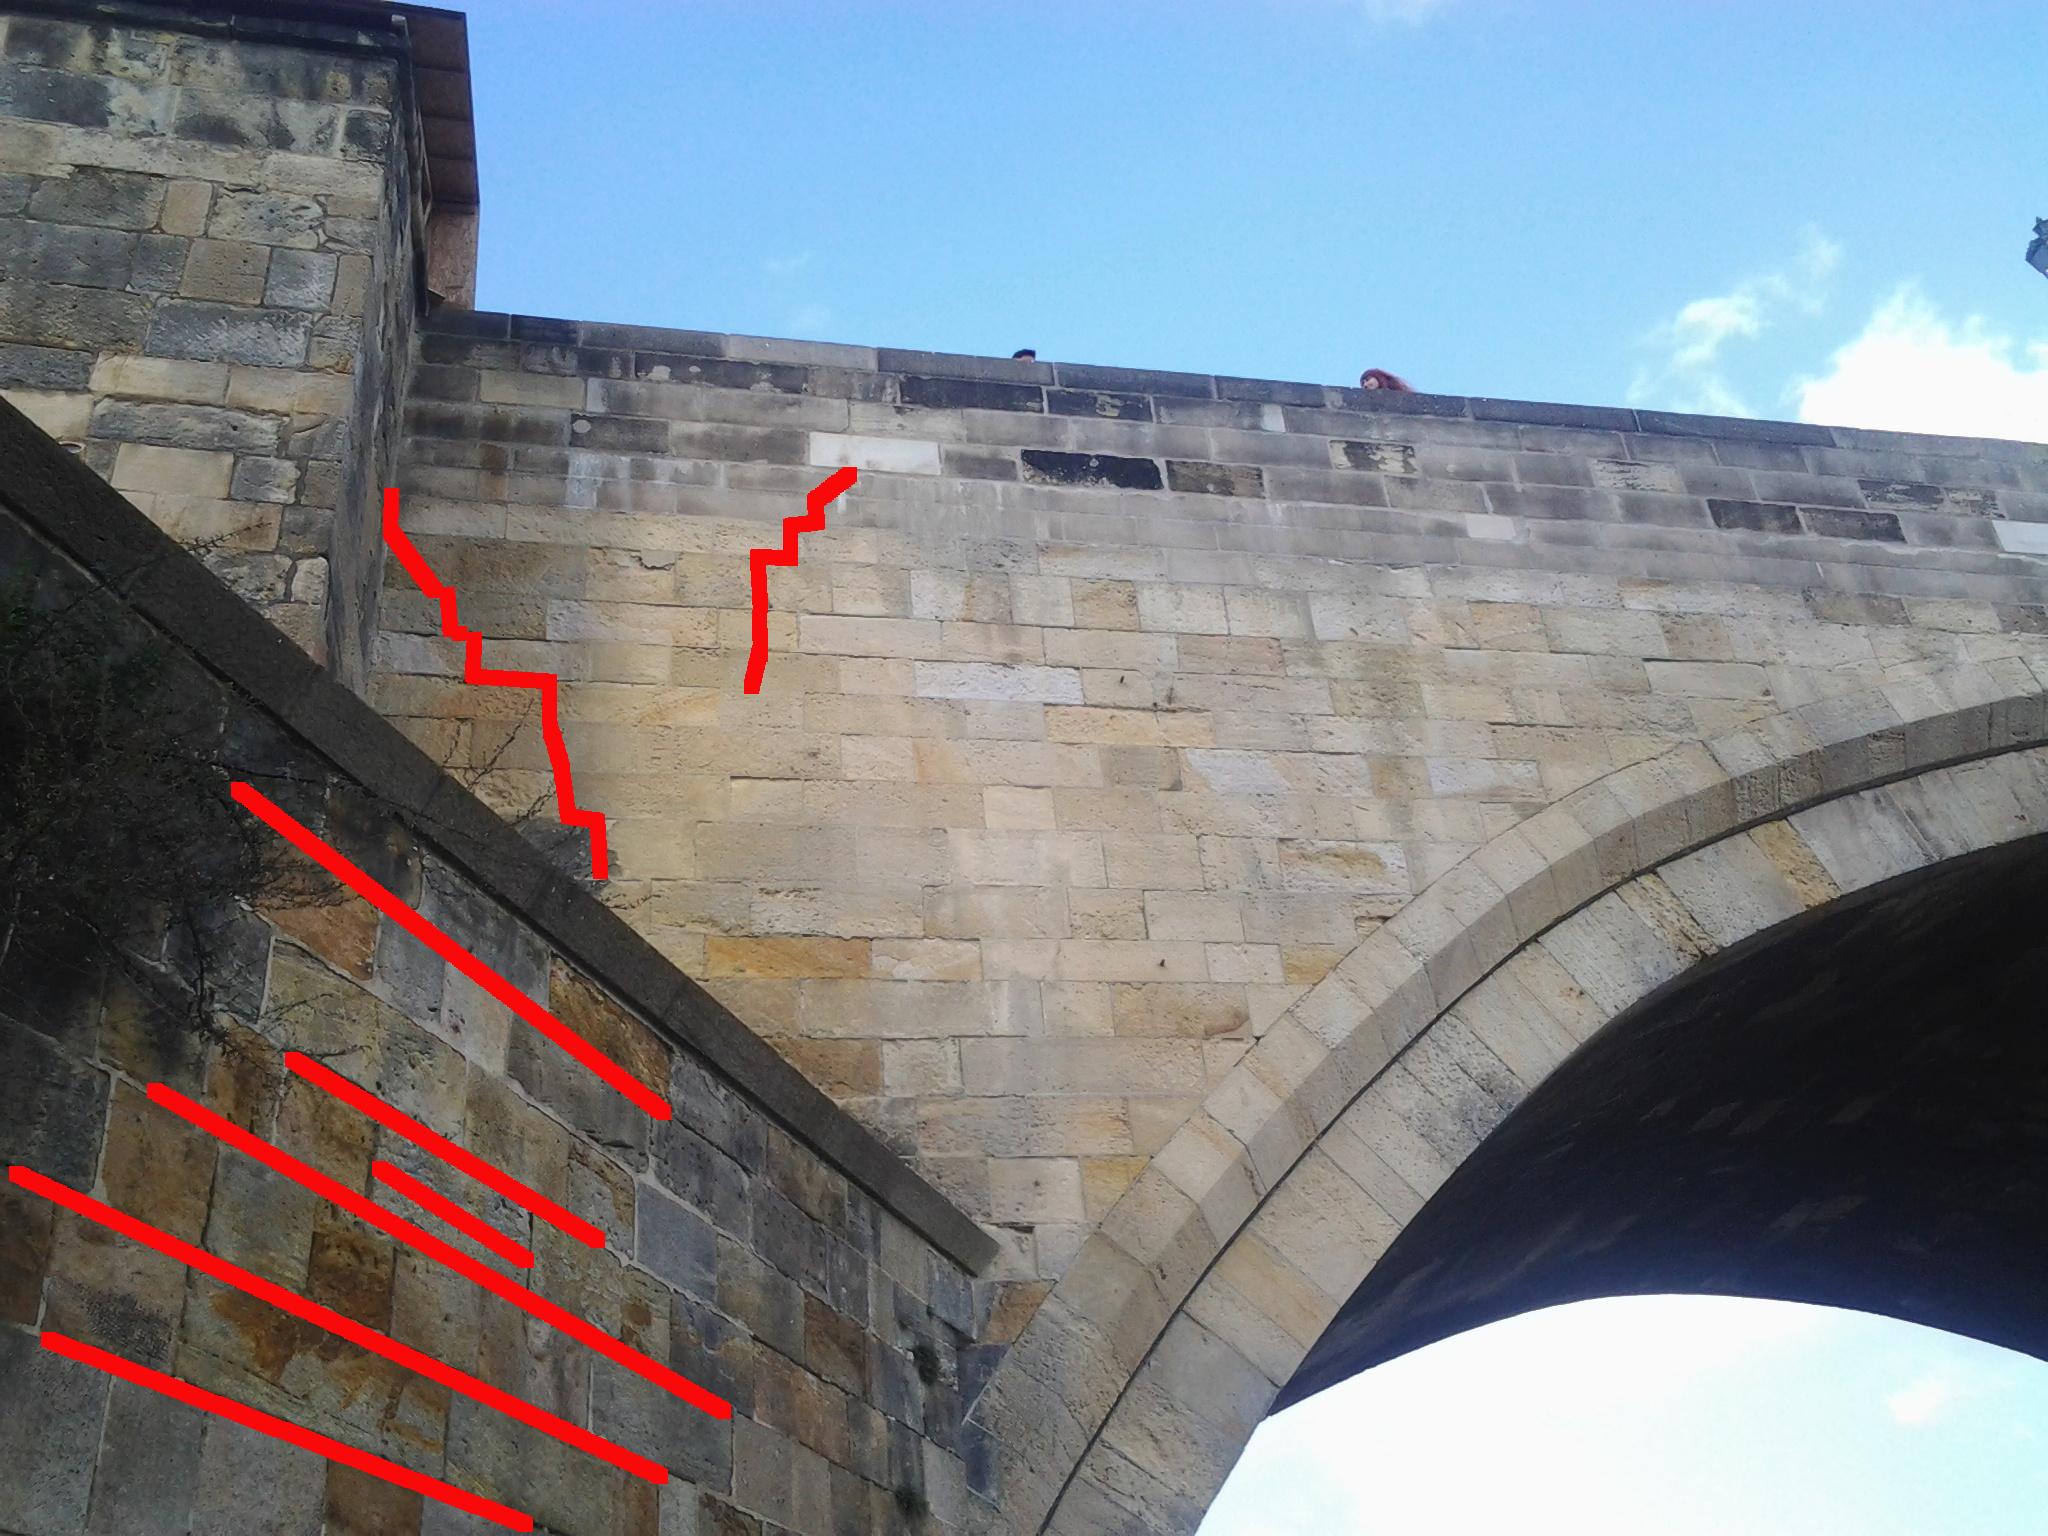
Distribution of the width of crack openings computed from tensile damage tensor after two year cycles in the first principal direction (left) in winter 2012; red highlighted visible cracks in breast walls (right) of arch X.
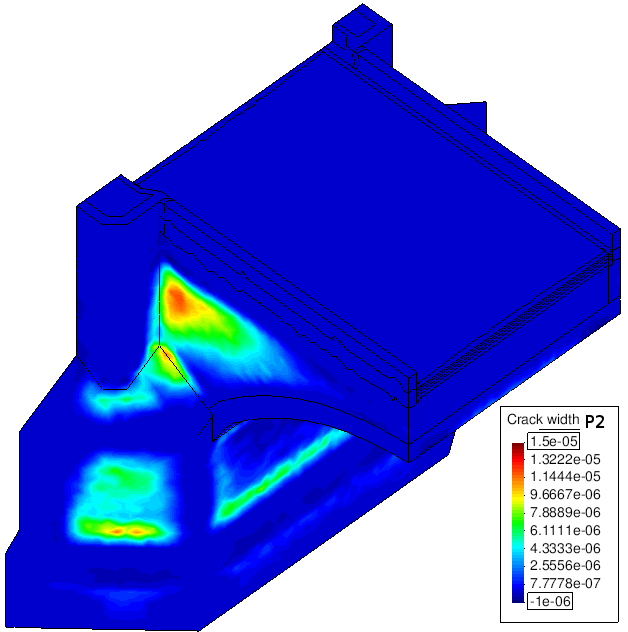
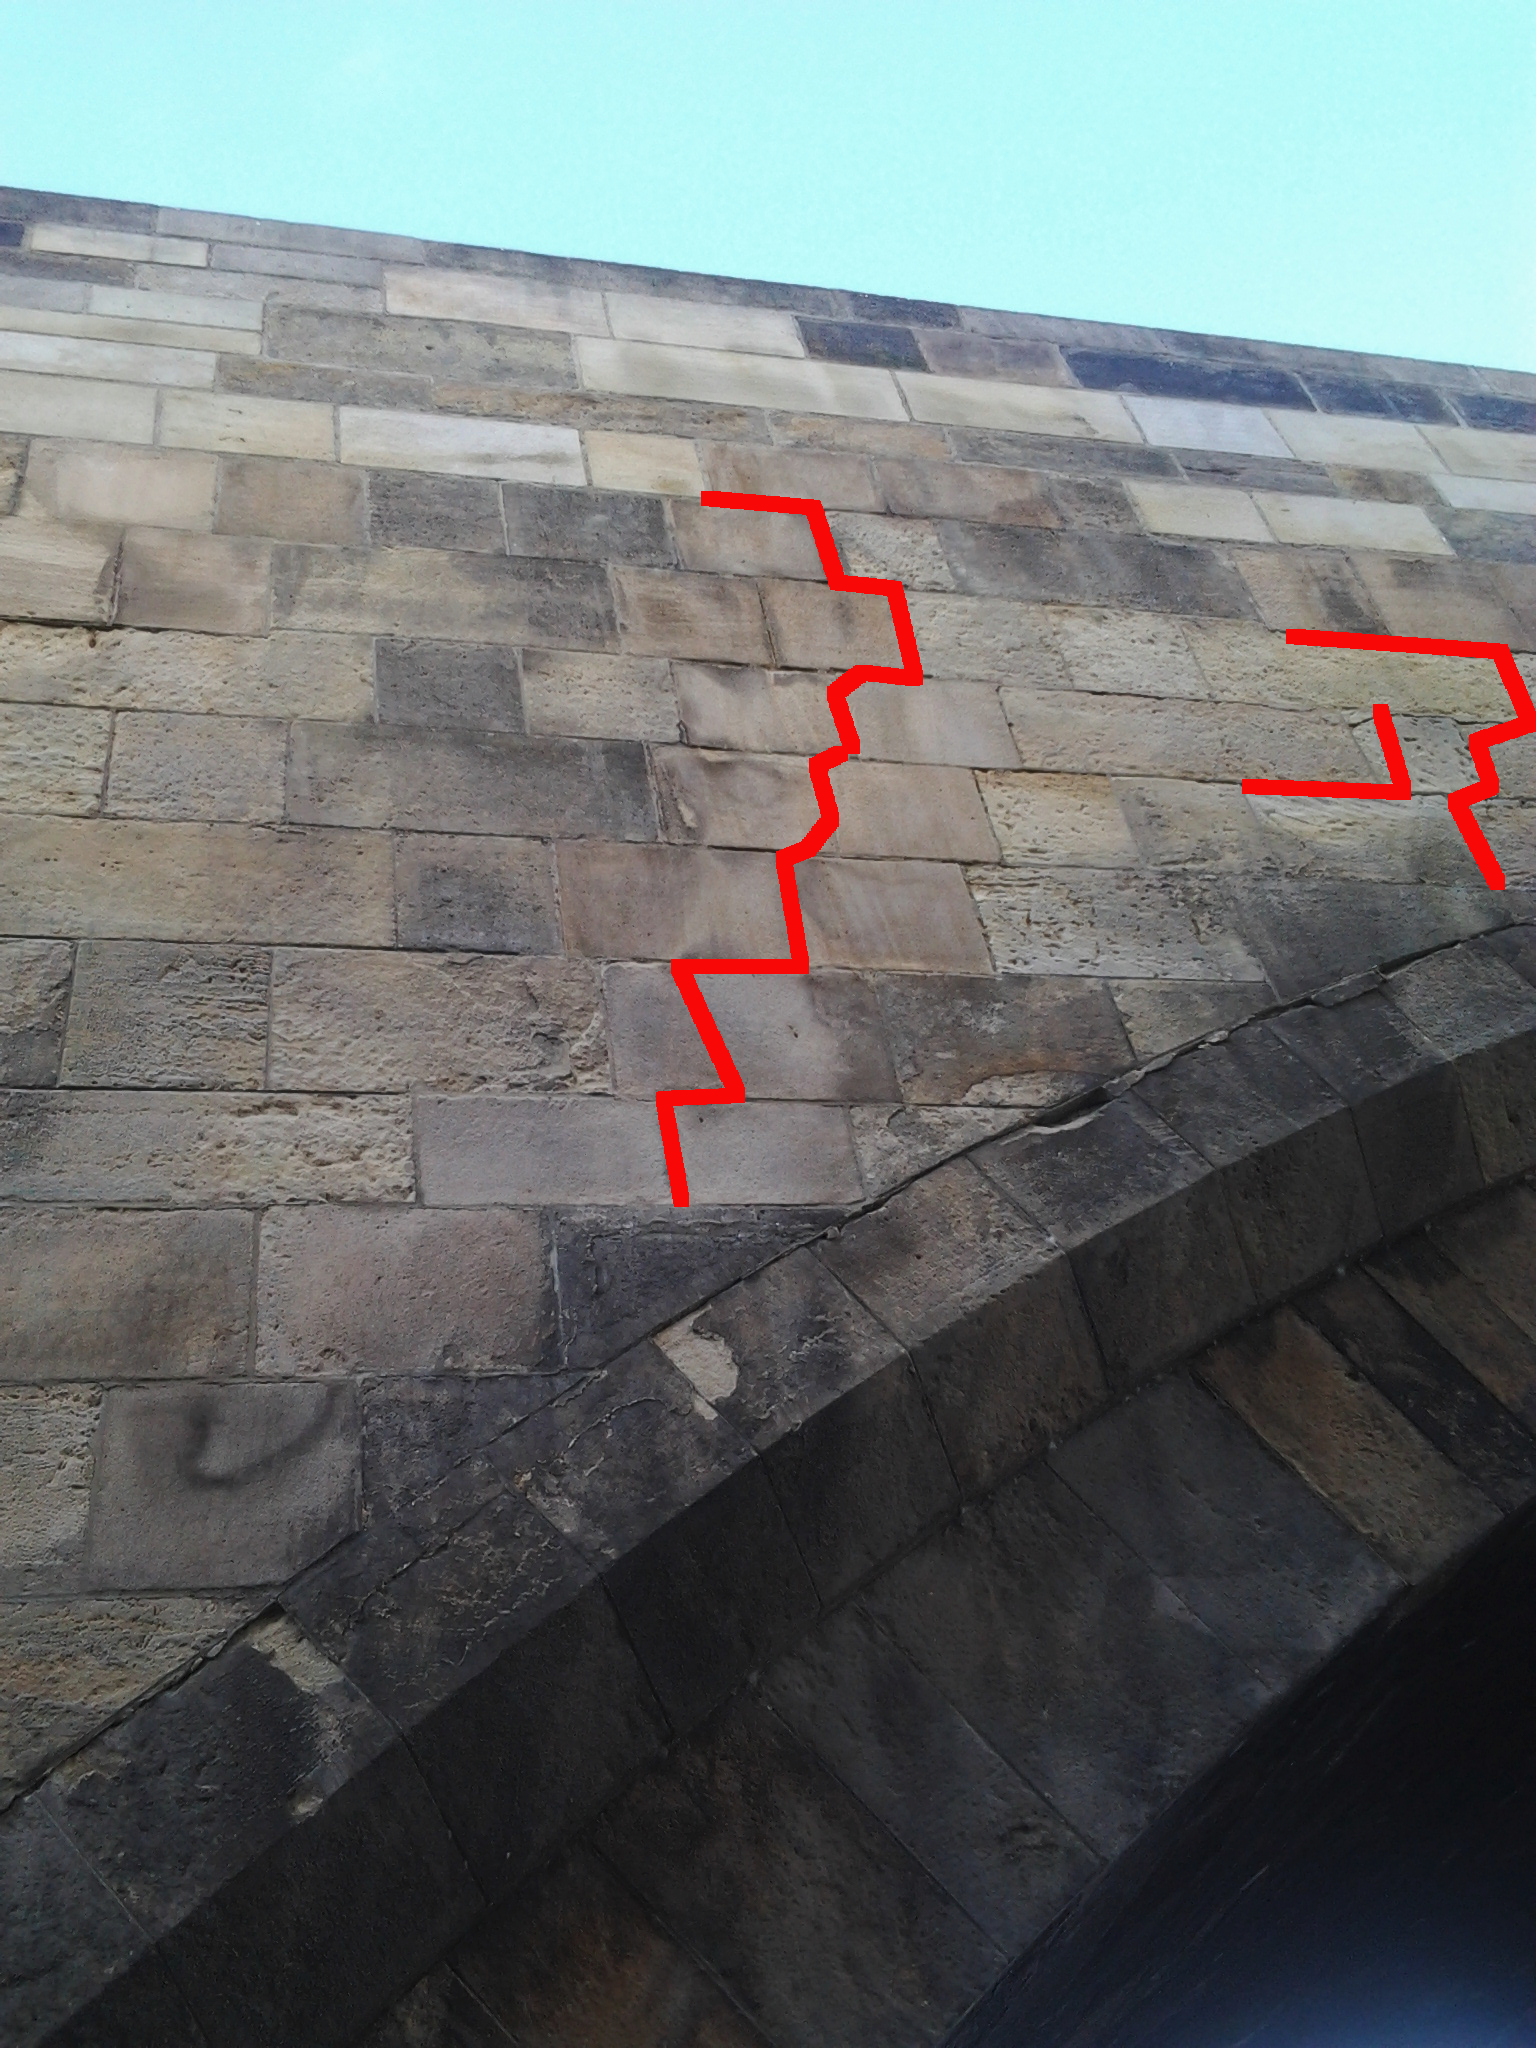
Distribution of the width of crack openings computed from tensile damage tensor after two year cycles in the second principal direction (left) in winter 2012; red highlighted visible cracks in breast walls (right) of arch X.